
Choosing a Battery Storage System requires more than comparing prices and advertised capacity. The right choice depends on daily energy use, solar production, backup needs, installation conditions, and future expansion. A system that looks impressive on paper may perform poorly in a shaded garage or during repeated winter outages.
Practical evaluation should examine usable capacity, round-trip efficiency, battery chemistry, operating temperature, warranty coverage, and safety controls. Small details matter. For example, a ten-kilowatt-hour battery may provide less usable energy after reserve limits and conversion losses. Monitoring software should also show clear data, including state of charge, power flow, alerts, and historical performance. These details help homeowners and businesses identify problems before a failed backup event.
Professional guidance remains valuable, especially when electrical loads, ventilation, or structural limitations complicate installation. Qualified installers can assess compatibility with inverters, solar panels, generators, and local grid requirements. Independent certifications and transparent warranty terms add confidence, but they do not remove the need for careful research. Capacity is not everything.
This guide presents ten practical tips for choosing a suitable system. It also considers degradation, maintenance, emergency access, installation costs, and long-term value. No checklist is perfect. Actual energy habits can change, and manufacturer estimates may differ from field performance. A thoughtful decision leaves room for uncertainty, verifies technical claims, and matches storage technology with real household or commercial needs.
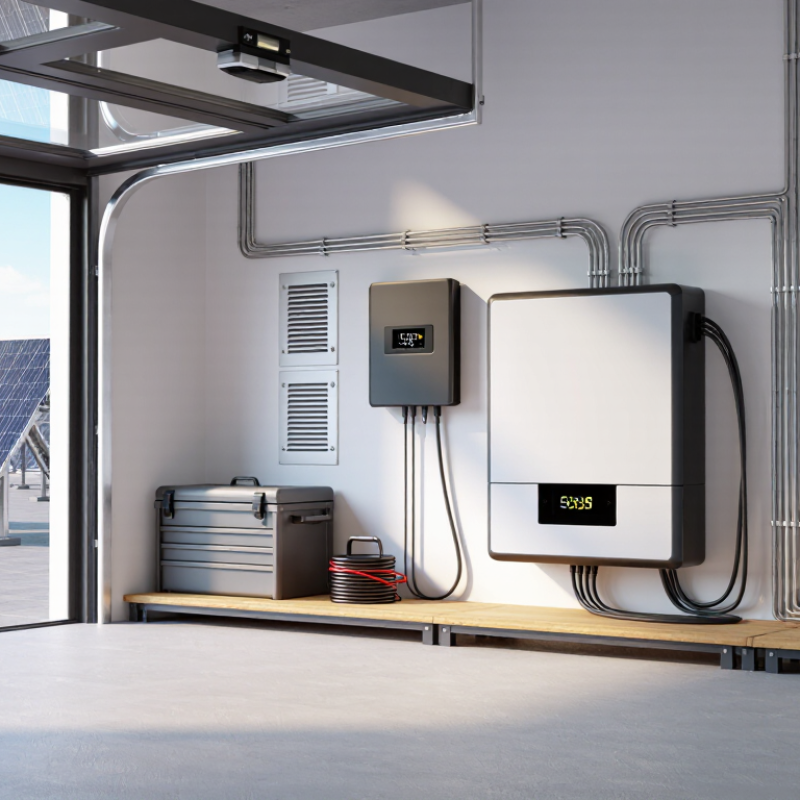
Define Load, Duration, and Peak Demand Before Sizing Storage
A battery system should begin with measured demand, not a guessed capacity. Record interval data in 5-minute or 15-minute blocks for at least one year. This reveals seasonal loads, overnight consumption, and short demand spikes. A home using 10 kWh daily may still need a 7 kW inverter for a brief motor start. Energy capacity and power capacity are different decisions.
Tip: Separate essential and flexible loads. Refrigeration, medical equipment, and communications may require backup. Water heating and vehicle charging can often shift outside peak periods. The International Energy Agency’s Batteries and Secure Energy Transitions report (2024) states that global energy storage capacity must increase sixfold by 2030. That growth makes disciplined sizing more important, not less. Oversizing wastes capital. Undersizing creates disappointing runtime.
Define duration with a real operating scenario. Ask whether the system must cover two hours, an overnight outage, or several cloudy days. Then account for usable capacity, round-trip efficiency, temperature, degradation, and reserve settings. NREL’s 2024 Annual Technology Baseline shows that battery costs vary substantially by configuration and duration. A longer-duration design is not simply a larger version of a short-duration system.
Tip: Test the calculation against the worst practical day. I once saw a load estimate exclude startup surges and winter heating; the spreadsheet looked precise, but the result was wrong. Recheck assumptions with measured data, an electrician, and the local interconnection requirements. Peak demand may deserve more attention than average consumption.
This representative commercial load profile shows why storage should be sized from measured demand rather than energy consumption alone. The facility reaches an approximately 120 kW peak during business hours. For a 60 kW critical-load requirement sustained for four hours, the system would need about 240 kWh of usable energy; allowing for a 90% usable depth of discharge requires approximately 267 kWh of nominal battery capacity. Actual sizing should also account for efficiency losses, temperature, degradation, reserve capacity, and future load growth.
Battery storage selection should start with measured round-trip efficiency, not advertised capacity alone.
The U.S. Department of Energy’s Energy Storage Handbook reports typical lithium-ion round-trip efficiency near 85–95%, depending on system design. For many commercial systems, 90–95% is achievable under moderate power and stable temperatures. That sounds excellent.
Yet auxiliary loads, inverter losses, and standby consumption reduce energy delivered to the building. Independent testing matters. Ask for AC-to-AC results, test conditions, and the usable-energy definition.
Cycle life deserves equal scrutiny.
DOE and Sandia National Laboratories’ Energy Storage Technology and Cost Characterization Report commonly places lithium-ion life around 3,000–10,000 cycles, depending on chemistry and operating conditions. Depth of discharge, heat, charging speed, and prolonged full charging accelerate degradation. A 6,000-cycle estimate may mean 80% remaining capacity, not a new battery. Read the warranty carefully.
Compare throughput limits, retained capacity, response time, and replacement terms. NREL’s Storage Futures Study also shows that modeled costs depend heavily on efficiency, lifetime, and utilization assumptions. In site work, I would calculate annual delivered kilowatt-hours from the actual load profile. Multiply usable capacity by realistic cycles, then subtract conversion losses. Temperature control can improve consistency, but it consumes energy and adds maintenance. A high-efficiency specification can disappoint when the system idles overnight.
Choosing a battery storage system requires more than comparing its starting capacity. A system rated at 10 kWh may deliver less usable energy after conversion losses and reserve settings. Ask how the manufacturer measures capacity fade. Is it based on cycle count, calendar age, or both? A reliable assessment should show expected capacity at years five and ten, not only on day one.
Tip: Request a written degradation curve.
Warranty language deserves careful reading. Check the guaranteed retained capacity, maximum energy throughput, cycle limits, and permitted operating temperature. Some warranties require approved installation, monitoring, or scheduled maintenance. Others exclude performance losses caused by frequent deep discharges. These details can change the practical value of the system. I would also confirm who handles warranty claims and how replacement labor is covered.
Tip: Read every exclusion.
Ten-year performance depends on daily habits and local conditions. High heat can accelerate aging, while a shaded, ventilated installation may reduce stress. Ask for performance estimates using your expected daily cycles, not ideal laboratory conditions. Compare results at 80%, 90%, and 100% depth of discharge. Real homes rarely match test settings. That uncertainty matters. A conservative projection may be more useful than an impressive promise. Keep installation records, software reports, and annual capacity checks. Small data gaps can make later disputes harder.
Choosing a battery storage system requires more than comparing capacity, price, and warranty length. Safety documentation deserves equal attention. UL 9540 evaluates the complete energy storage system, including batteries, controls, and connected equipment. Ask for a current certification record, not only a component test report. A cell listing does not prove system-level compliance. Check the exact model, configuration, and operating limits.
NFPA 855 provides installation guidance for stationary energy storage systems. It addresses separation distances, fire detection, ventilation, emergency access, and protection measures. Requirements may vary with system size, chemistry, building type, and local code adoption. Confirm the applicable edition with the authority having jurisdiction. Do not treat NFPA 855 as a product certificate. It guides safe deployment. A qualified electrical or fire-protection professional should review the site drawings before purchase.
Request UL 9540A test data when thermal runaway behavior affects the design. Review propagation results, gas hazards, extinguishing methods, and emergency procedures. Inspect whether the proposed enclosure matches the tested configuration. Small changes can matter. Also verify alarm integration, shutdown controls, maintenance access, and commissioning records. Paperwork can look complete while field conditions remain overlooked. That is an uncomfortable gap. Leave room for correction after installation, because real airflow, temperatures, and clearances may differ from the plan.
A battery quote is not its real price. Build a ten-year cost model before comparing systems. Include equipment, installation, permits, electrical upgrades, monitoring, maintenance, and a replacement reserve. Ask for written assumptions about usable capacity and warranty coverage. I once ignored installation costs in an early estimate. The projected payback looked excellent. It was not.
Use hourly electricity bills, not only monthly totals. Mark expensive peak periods and compare them with the battery’s charging schedule. A time-of-use tariff can create strong savings when evening prices rise. However, low export credits may reduce the value of stored solar energy. Demand charges can change the calculation again. Check whether your utility updates tariffs annually.
Model available incentives carefully. Some reduce upfront costs, while others depend on eligibility, installation dates, or local rules. Never count an incentive until its requirements are confirmed. Calculate net cost after verified incentives, then divide it by realistic annual savings. Simple payback is useful, but incomplete. Include battery degradation, efficiency losses, financing interest, and future electricity prices. Run conservative, expected, and optimistic scenarios. A five-year payback may become eight years after weaker tariffs or lower system performance. That possibility deserves attention. Leave room for repairs and changing household usage. Real projects are rarely perfect.
| Tip | Decision Dimension | Recommended Check | Illustrative Input | Estimated Annual Effect | Why It Matters |
|---|---|---|---|---|---|
| 1 | Match usable capacity to the load | Compare daily energy consumption with usable battery capacity rather than nameplate capacity. | 10 kWh nominal 9 kWh usable | Approx. 1.0 cycle/day | Oversizing increases upfront cost, while undersizing can limit bill savings and backup duration. |
| 2 | Check power output | Confirm continuous and surge ratings for essential appliances, pumps, and motor loads. | 5 kW continuous 7.5 kW surge | Supports typical essential-load circuits | Energy capacity and power capacity are different; a large battery may still be unable to start high-power equipment. |
| 3 | Use the correct tariff spread | Compare the off-peak charging rate with the peak rate avoided during discharge. | Off-peak: $0.12/kWh Peak: $0.32/kWh | $0.20/kWh gross spread | A wider time-of-use spread generally improves battery economics. |
| 4 | Include round-trip efficiency | Calculate savings using energy delivered, not only energy charged into the battery. | 90% round-trip efficiency | 9 kWh delivered from 10 kWh charged | Charging losses reduce the effective tariff savings and should be included in every payback model. |
| 5 | Separate hardware from soft costs | Request an itemized quotation covering battery, inverter, installation, permits, and electrical upgrades. | Hardware: $7,000 Installation: $2,000 Other costs: $1,000 | Gross project cost: $10,000 | The lowest equipment price may not produce the lowest installed or lifetime cost. |
| 6 | Verify incentives and eligibility | Check current national, regional, and utility programs, including installation and labor eligibility. | Illustrative incentive: 30% | $3,000 potential reduction | Incentive rules, caps, deadlines, and tax treatment vary; confirm them before signing a contract. |
| 7 | Calculate net installed cost | Use: Gross cost − confirmed incentives + financing fees + required upgrades. | $10,000 − $3,000 + $500 fees | Net cost: $7,500 | Payback should be based on the amount actually paid, not the pre-incentive quotation. |
| 8 | Estimate annual bill savings | Multiply delivered energy by the net avoided tariff and adjust for expected cycling days. | 9 kWh × $0.20 × 300 days | $540 gross annual savings | Actual savings depend on weather, occupancy, solar output, outages, and the number of usable cycles. |
| 9 | Allow for degradation and maintenance | Model declining capacity and include monitoring, service, insurance, and eventual replacement costs. | 2% annual savings reduction $100 annual allowance | Year-one net benefit: $440 | Ignoring degradation and operating costs can make projected returns appear better than they are. |
| 10 | Calculate projected simple payback | Use: Net installed cost ÷ first-year net benefit, then test conservative and high-savings cases. | $7,500 ÷ $440 | Approx. 17.0 years | Compare the result with the warranty period, expected service life, financing term, and non-financial backup benefits. |
| Illustrative project summary | Gross cost: $10,000 Incentive: $3,000 | Net cost: $7,500 Annual net benefit: $440 | Projected simple payback: approximately 17 years | ||
By continuing to use the site, you agree to the use of cookies. more information
The cookie settings on this website are set to "allow cookies" to give you the best browsing experience possible. If you continue to use this website without changing your cookie settings or you click "Accept" below then you are consenting to this.